
Standard deviation is a statistical way of measuring the dispersion of a dataset. It is time confusing and tiresome to calculate standard deviation manually. To ease the process of calculating standard deviation, new methods have been developed. Excel is a powerful tool that can be used to calculate standard deviation in just a few steps.
In this article, we shall discuss how to calculate standard deviation in Excel.
Generating standard deviation formula automatically
You don't have to cram the Excel function of calculating standard deviation. Excel allows you to generate the formula automatically and include it in your data. Below are the steps to use this Excel function.
1. To get started, open your Excel application.
2. Then, open an existing or a new document. If you're working on an existing document, you can open it from your Pc or use the keyboard shortcut to access it (Ctrl + O).
3. If you're working on a new document, enter the dataset that you wish to calculate its standard deviation.
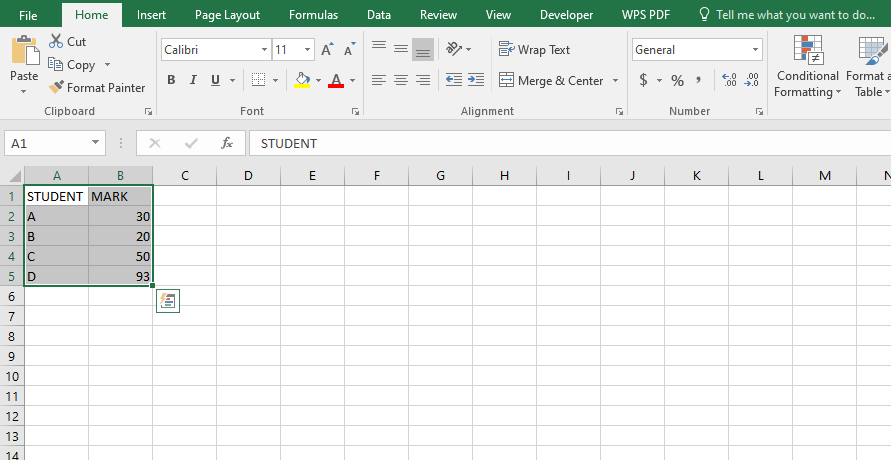
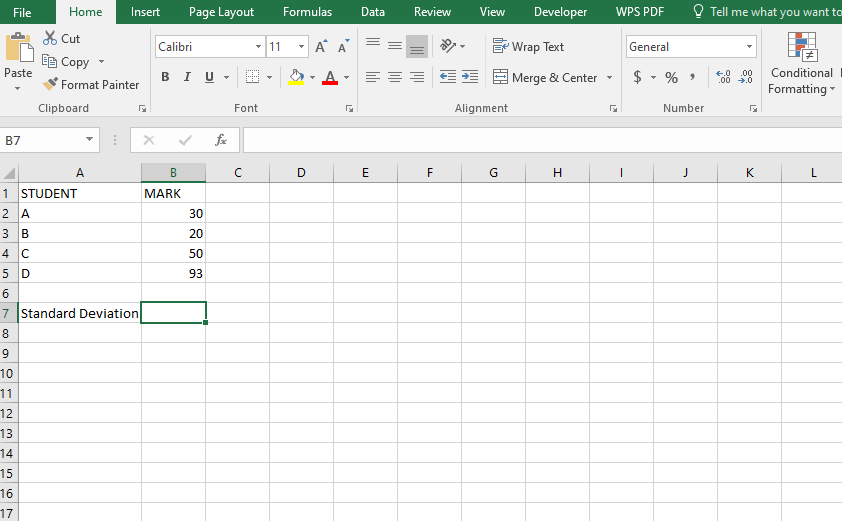
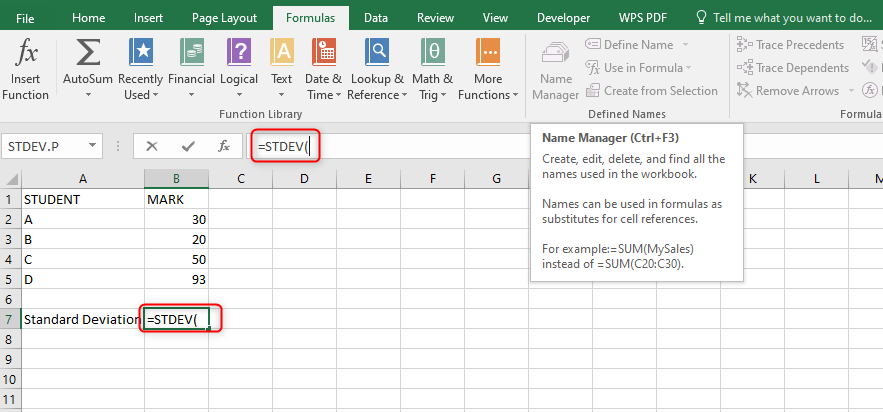
4. Select another cell by clicking on it. You can name it " Standard Deviation."
5. Click on the empty cell that will hold your standard deviation results.
6. On the formulas tab, locate the "More function" button found within the "Function Library" section.
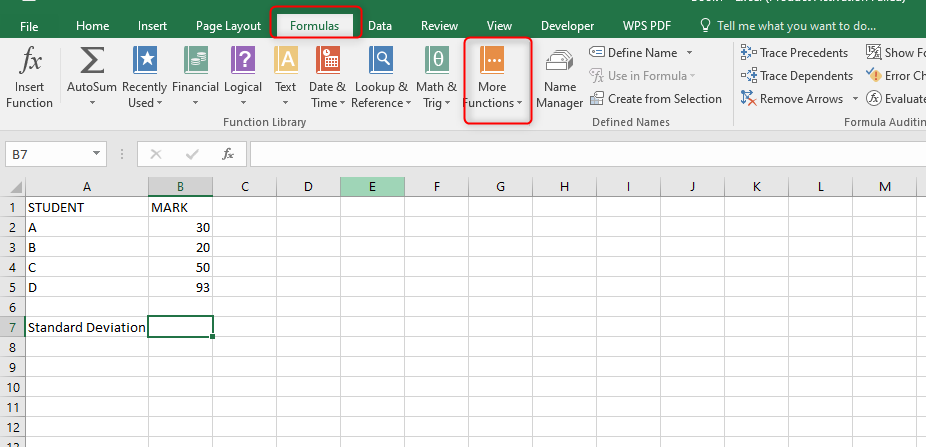
7. Click on the drop-down menu found within the "More Functions" button.
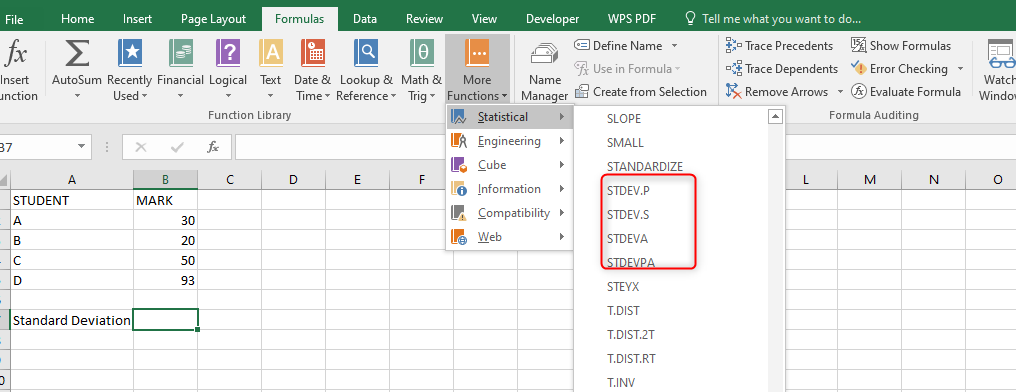
8. On the side-view menu displayed, hover your mouse on the "Statistical" button.
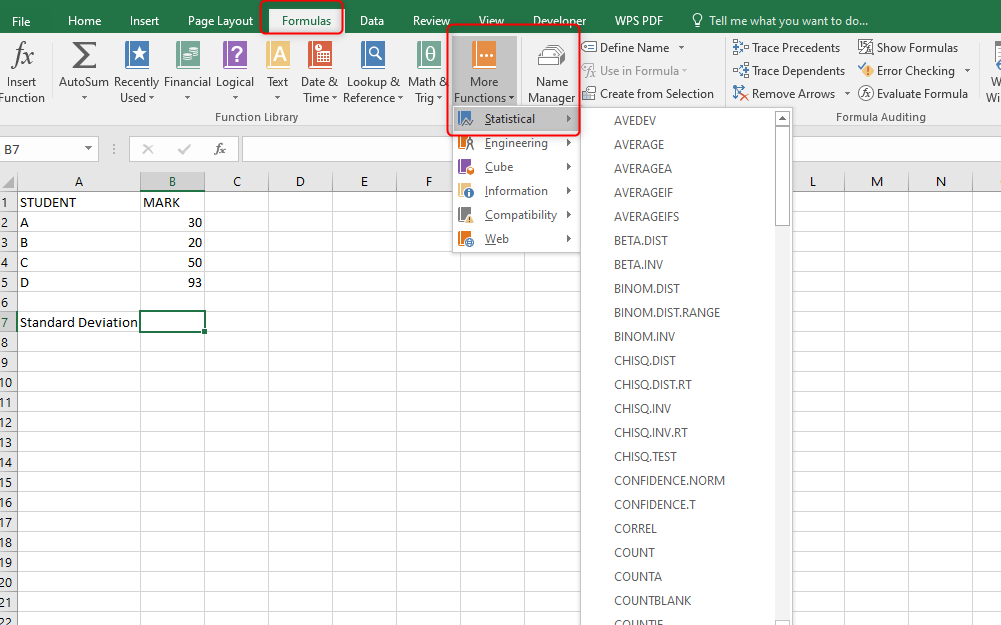
9. On the list of functions displayed, choose either the "STDEV", "STDEVA", STDEVP" or "STDEVPA." Excel has a different type of Standard deviation function, it is upon you to choose the function that fits your work best.
10. After choosing the standard deviation function, a Function arguments dialogue box opens. On this dialogue box, click on the "number 1" section.
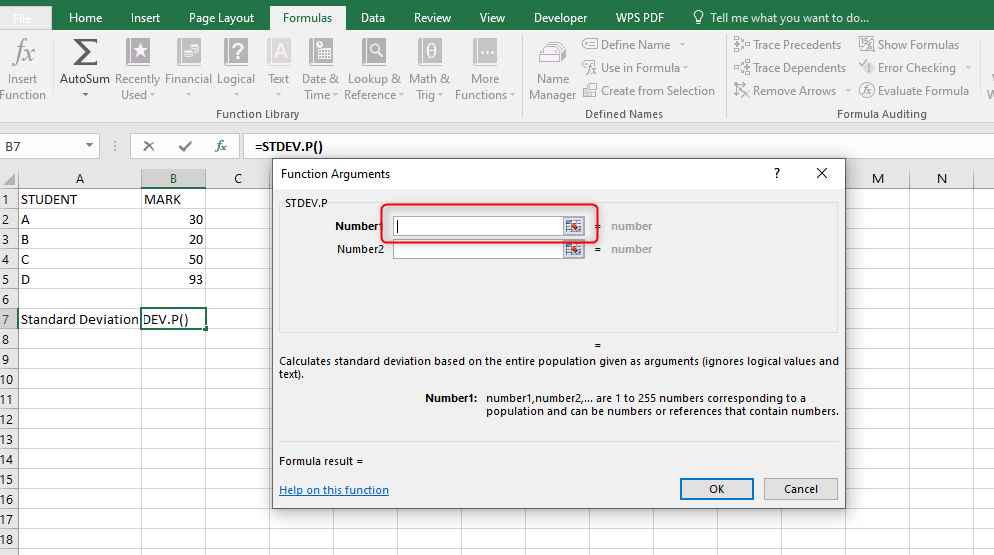
11. Then, highlight the column with your data.

12. Finalize by clicking the "Ok" button. The standard deviation will be calculated automatically and will be stored in the cell you had earlier selected.
Generating standard deviation formula manually
Apart from using the statistical feature to generate standard deviation formula, you can also input it manually. Here are the steps to do so;
1. To get started, open your Excel application.
2. Then, open an existing or a new document. If you're working on an existing document, you can open it from your Pc or use the keyboard shortcut to access it (Ctrl + O).
3. If you're working on a new document, enter the dataset that you wish to calculate its standard deviation.
4. Select another cell and name it " Standard Deviation."
5. Next to the selected cell, enter the standard deviation formula.
=STDEV(
6. Then, select the column that has your dataset.
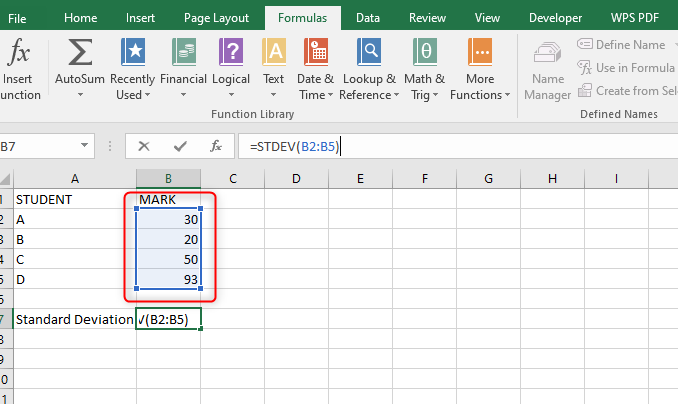
7. After selecting, terminate the formula with a closing bracket and press the Enter button. The standard deviation will be calculated and will be stored in the cell that contained your formula.
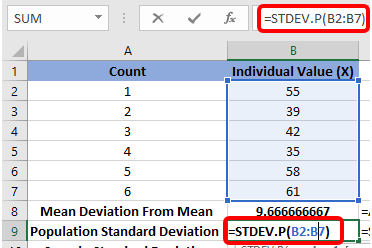
Using STDEV.P To Calculate Standard Deviation in Excel 2007
This function calculates the standard deviation based on the entire population. It is represented by the syntax below:
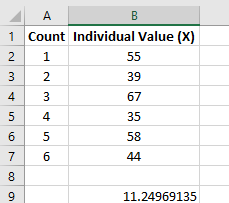
For example, if x1=5, x2=1, x3=4, x4=6, x5=9, µ=5(mean), N=5 (number of data points), and the average weight is 69.20, the formula will return 2.81 as the Standard Deviation. Thus, people in this group are categorized within the weight range of 69.2-2-2.81 and 69.2+69.2+2.81. Using the formula below, you can reach the Standard Deviation following these steps:
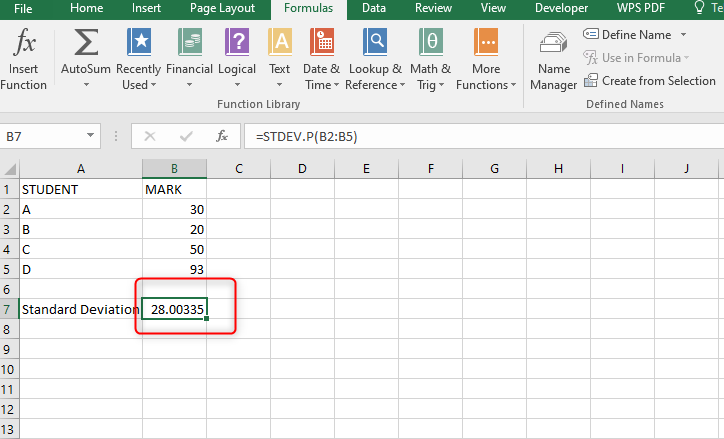
=STDEV.P(A1:A10)
Steps:
1. Open your Microsoft Excel.
2. Click on Blank Workbook at the upper left of the Excel launch page.
3. Enter the value you want to use. Choose the column that you wish to enter the data, and type each data value into individual cells in it. For instance, if you choose column “A” as the area in which you want to enter your data, you might type a number into A1, A2, cell A3, and so on.

4. Click a blank cell in which you want to display the standard deviation value, and select the cell.
5. Type in the standard deviation formula.
6. Add your value range and type the letter in between the parentheses, and the number of the cell containing your first piece of data, type in a colon (:), and type in the letter and number of the data cell.
For example; you would have the formula =STDEV.P(A1:A10) if you entered the data in cell range A1 to A10.
You can type the cells separately by commas if you want to display the Standard Deviation of the value of a few scattered cells, such as A1, B3, and C5.
7. Press Enter to display the Standard Deviation of your selected cells in the formula cell.

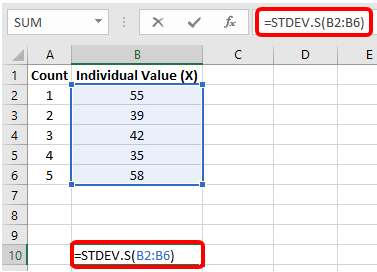
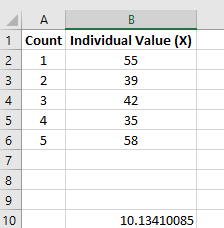
Using STDEV.S Formula
The STDEV.S function gives the estimated Standard Deviation of a sample, where S stands for Sample. It is represented by the syntax:
=STDEV (number1, [number2], …), where;
Number 1 is the first number or reference in the sample. However, you can use a named range, single array, or reference to an array instead of arguments separated by commas.
Number 2 is the second number or reference (optional). It can refer to a data point, a named range, a single array, or a reference to an array.
1. Suppose you have weight data recorded in cells A2 to A10, you can use the formula below to calculate its Standard Deviation.
=STDV.S(A2:A10)
However, when using Excel 2007, you can use:
=STDV(D2:D10).
2. Press the Enter button. The formula will return the Standard Deviation, which represents the average weight range.
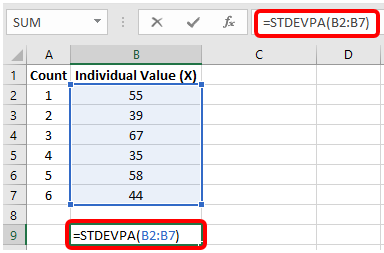
Using STDEVPA Function
This function is used to estimate the Standard Deviation for an entire population. It calculates the standard deviation for data that represents an entire population using the “n” method. Thus, it evaluates the text and logic as numbers as part of the calculation, where text is evaluated as zero, TRUE is evaluated as 1, and FALSE is evaluated as zero. Its generic formula is:
=STDEVPA (number1, [number2], …), where;
Number 1 is the first reference in the sample
Number 2 is the second number or reference (optional)
Steps
1. Copy the data in the table.
2. Paste it into the cell A1 of a new Excel worksheet.
3. Select the formula to show results, and press F2.
4. Press Enter. You can adjust the column widths to see all data.